Noise maps
Interactive block-level noise heatmaps for every city in the 311info catalog with sufficient geocoded 311 noise-complaint data. Tap any block or search any address to get a “complaints per week within a block” count, computed directly from each city’s open data portal.
Current release
Data through August 2026
Last record: August 8, 2026
Monthly refresh · 3 cities records
How these maps are built
For each eligible city, every geocoded 311 noise complaint from the trailing 12 months is placed at its reported lat/lng and weighted by complaint type (construction and amplified music count more) and time of day (complaints filed 10pm to 7am count 2×, reflecting the disproportionate health impact of night noise). The city is tiled into a 200m grid and each cell’s density is computed via Gaussian KDE (σ = 200m). Tapping or searching an address returns a raw, unweighted “complaints per week within a block” count directly verifiable against the city’s open data feed.
Cities with a noise map
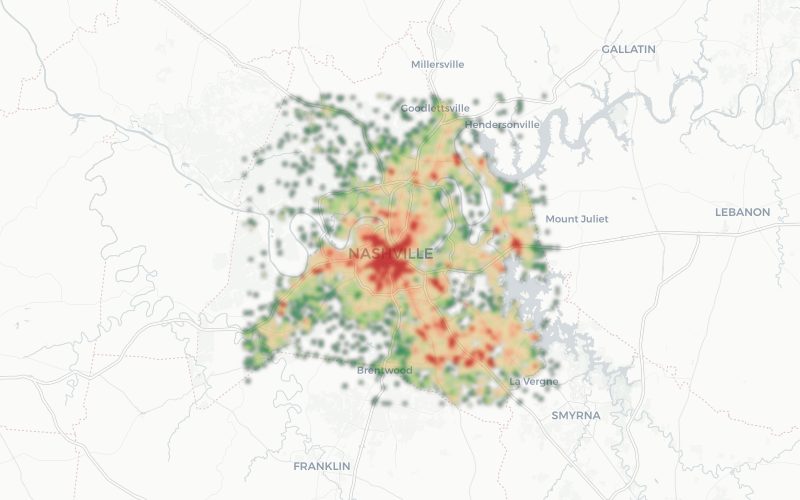
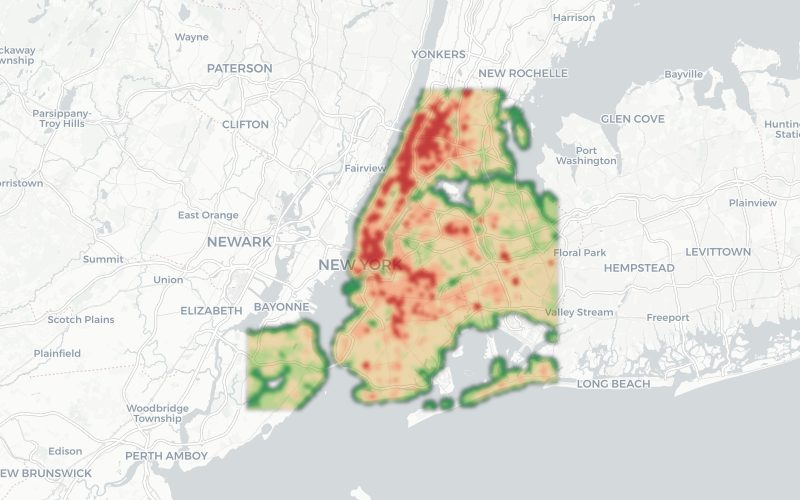
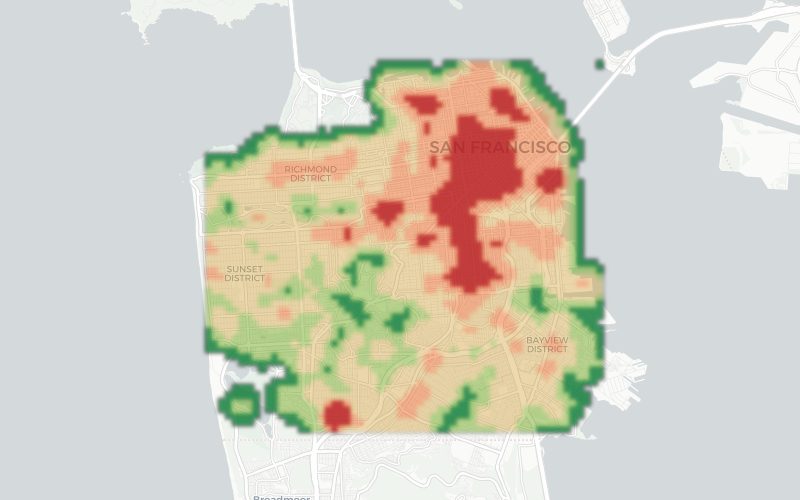
Cities without a noise map
A city becomes eligible for a noise map when its 311 feed publishes at least 500 geocoded noise-category complaints in the trailing year and those complaints are spread across at least 20% of the city’s mapped area. Cities where complaints concentrate in a small area may not qualify even with high total complaint volume. Chicago is a special case: its 311 system publishes a large volume of noise complaints, but 100% are aircraft-noise filings with no reported coordinates, so there’s nothing to pin on a map.
- AustinTX
- BaltimoreMD
- Baton RougeLA
- BostonMA
- BuffaloNY
- CalgaryAB
- CharlotteNC
- ChicagoIL
- ClevelandOH
- EdmontonAB
- IndianapolisIN
- Los AngelesCA
- LouisvilleKY
- MinneapolisMN
- MontréalQC
- New OrleansLA
- OaklandCA
- OttawaON
- PhiladelphiaPA
- PittsburghPA
- San DiegoCA
- San JoseCA
- SeattleWA
- SomervilleMA
- St. LouisMO
- TorontoON
- VancouverBC
- WashingtonDC
- WinnipegMB
The complaints per week within a blockcount shown on each map is the direct, unweighted number you can verify against the city’s open data feed. Counts are not comparable across cities in absolute terms — cities differ in population density, reporting culture, and 311 system design. Full methodology →